199 instruments · OTC quotes 24/7

Charts for markets nobody else charts.

Professional charting for the OTC book your broker quotes and for the real market — a deep indicator suite, replay with the future hidden, and a learning path that reports what it measured. The costs are on screen, not in the small print.

EUR/USD15m REAL BARS
drawn from recorded history — not an illustration
Spread 0.00001 · 240 samples 92% payout → 52.1% to break even
199instruments, two live books
24/7OTC quotes; crypto through the weekend
24drawing tools that survive weekend gaps
36lessons, none of which promise you profits

Markets

The OTC book, and the real one.

Most platforms chart the same hundred symbols. OTCharts carries 109 broker-quoted OTC instruments no mainstream charting product touches — quoted around the clock — alongside 90 real instruments from a live institutional feed: the full G8 matrix, exotics, metals and crypto. The two books are kept strictly apart, because they are different things and the app says so.

OTC book 109

Currencies, commodities, stocks and indices as the broker quotes them. Trades 24/7, broker-time clock handled for you — and more brokers' books are on the way.

Forex 62

The complete G8 matrix plus 32 exotics, at real market prices. Closed weekends — and the chart says closed instead of inventing bars.

Metals 11

Gold, silver, platinum, palladium — including gold against EUR, GBP, JPY, AUD and CHF as instruments of their own.

Crypto 19

BTC, ETH and seventeen more on the same feed, quoting straight through the weekend the rest of the book sleeps.

The chart

A terminal, not a widget.

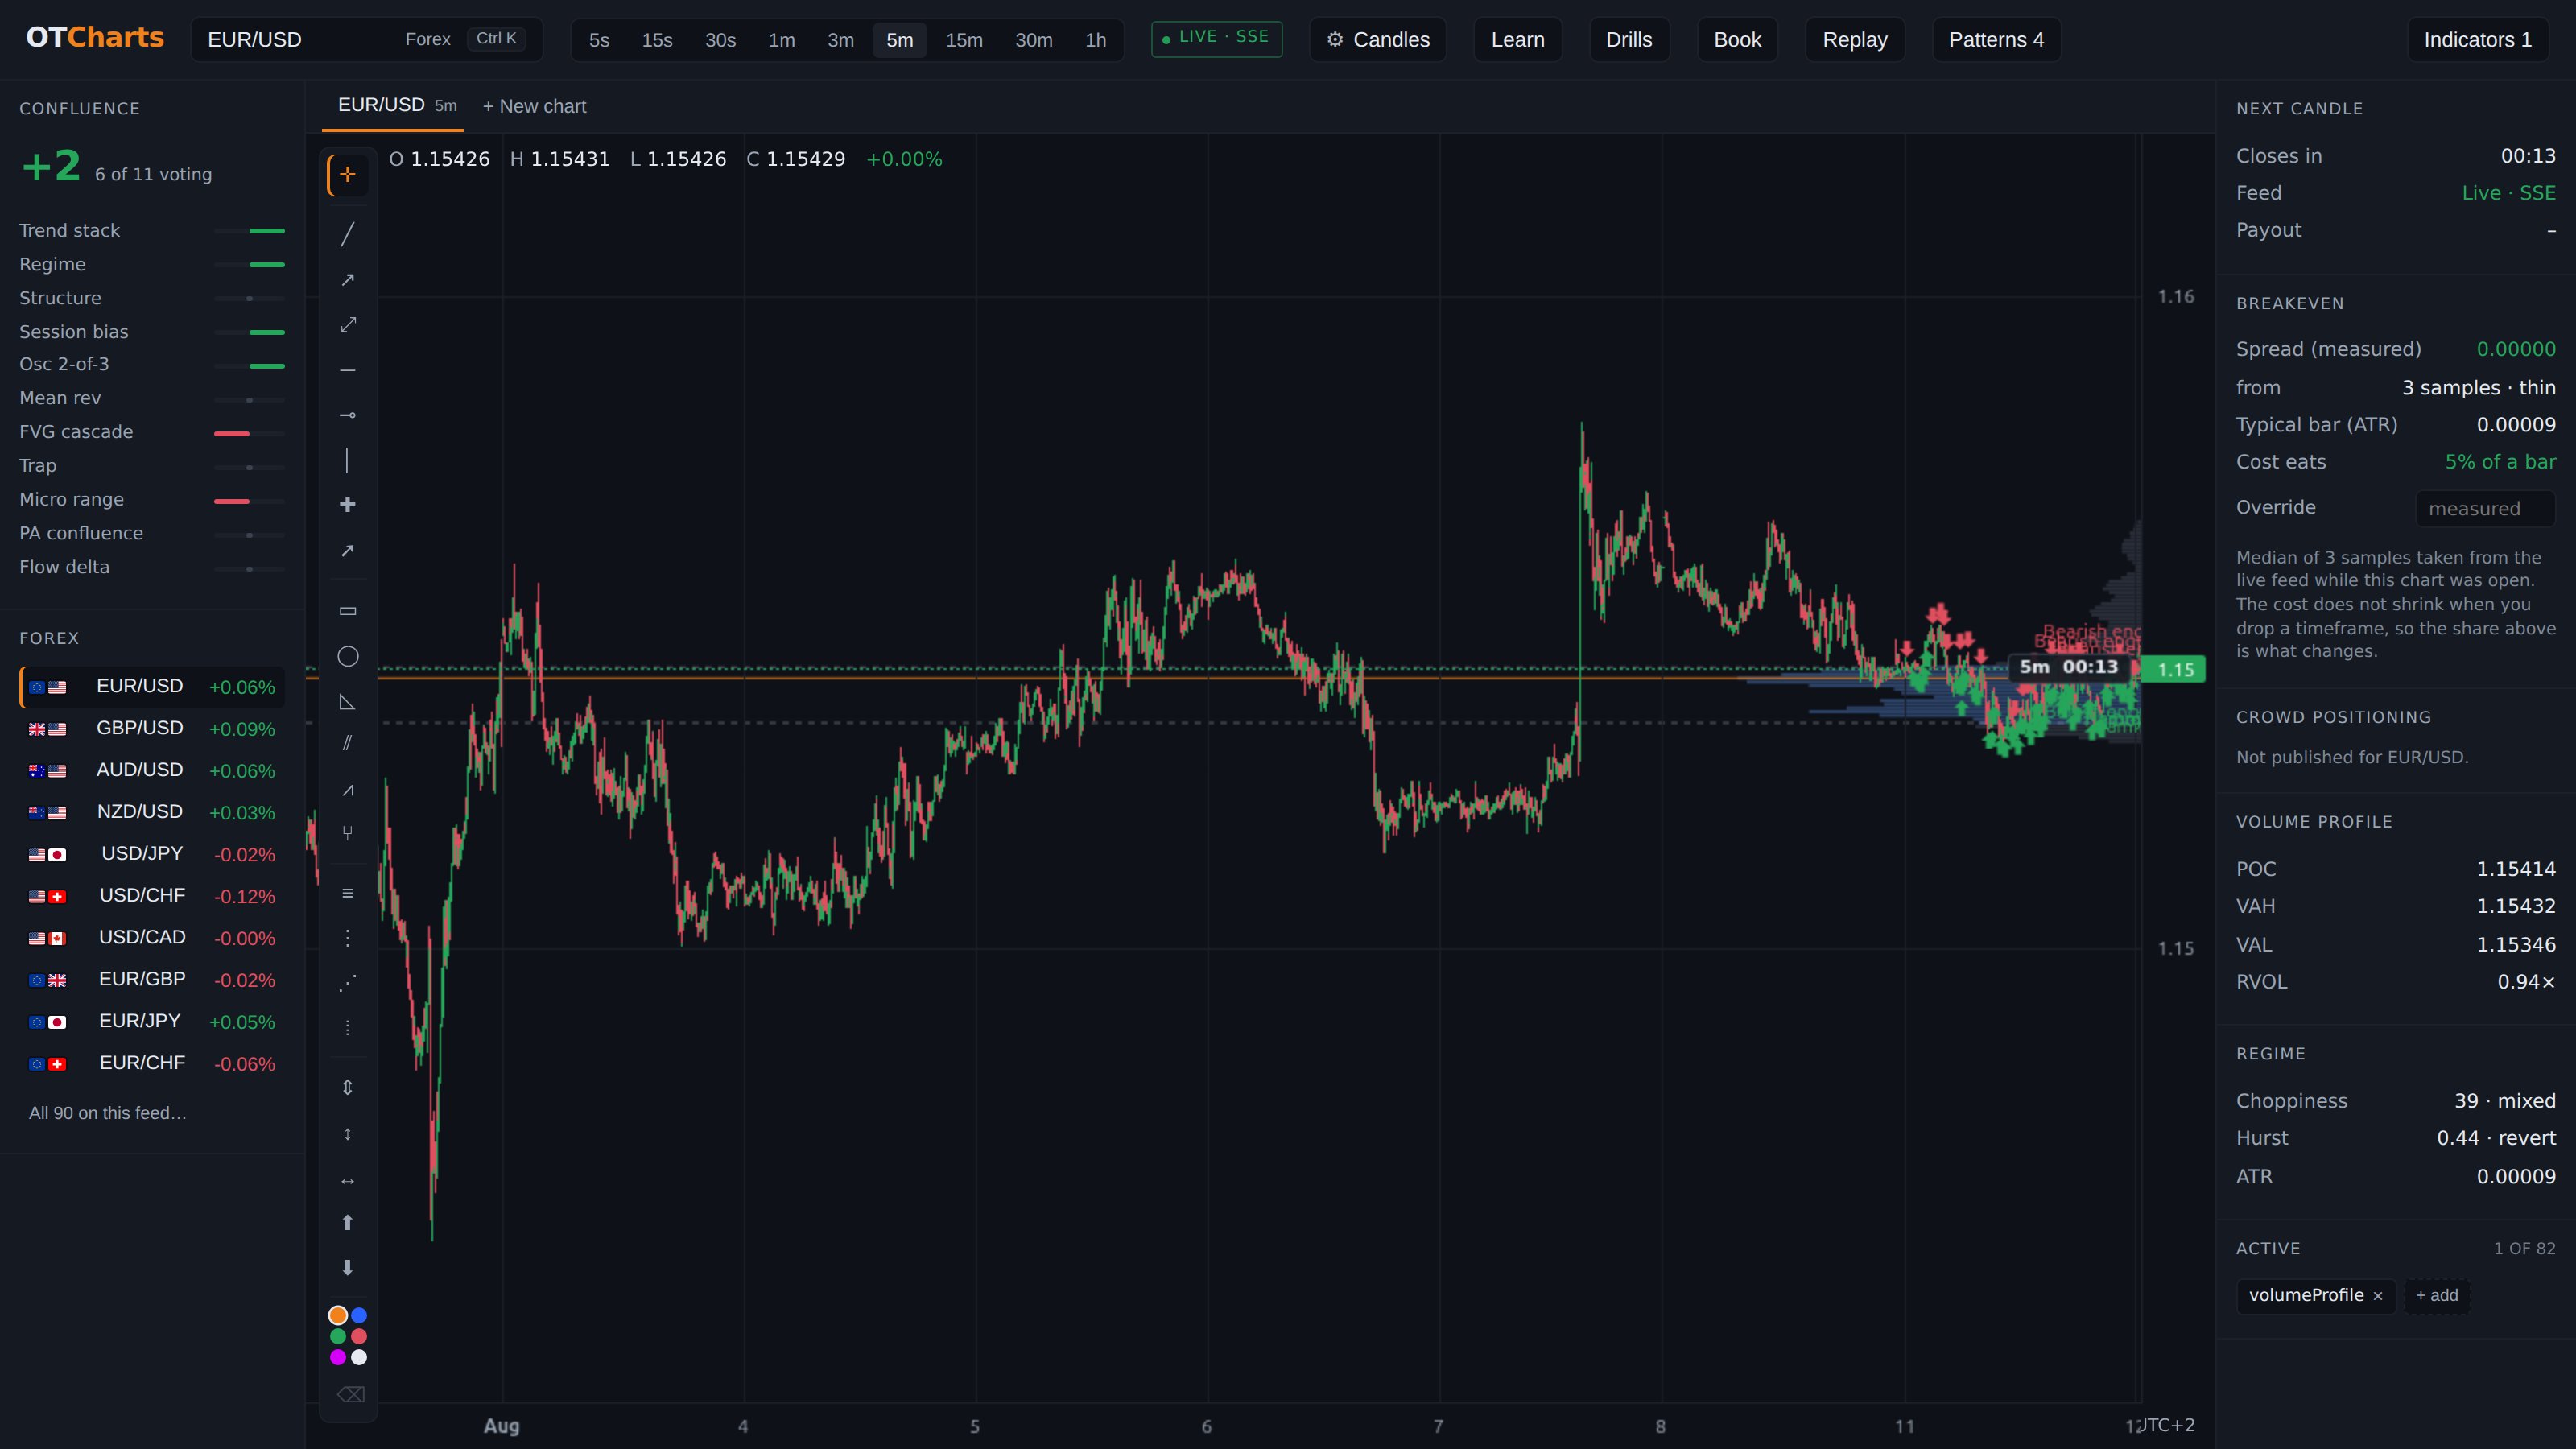
Multi-tab workspaces that survive a reload. Indicators for every school of analysis — trend, momentum, volume, volatility, price action — computed in a worker so the chart never stutters, with more landing steadily. Drawing tools that survive weekend gaps. Pattern detection that marks real bars — and a reference where every one of the 80 example drawings is real history that actually triggered the detector, with the instrument and timestamp attached.

The OTCharts terminal: EUR/USD 5-minute chart with volume profile, confluence rail, watchlist and breakeven panel
the actual terminal — interface and bars both real; click to open it EUR/USD 5m · live feed · captured 2026-08-12

And two drawings from the pattern reference:

Morning starBTC/USD 5m · found 2026-07-30 10:40 UTC
Head & shouldersGold 5m · found 2026-07-27 08:25 UTC

Replay with the future hidden

Wind back, commit to a view, then find out. The indicators only see the bars you can see — no lookahead, for you or for them.

A record that argues back

Practice trades resolve at their stop, target or clock — you do not get to change your mind. The record reports a confidence interval and how a coin would have done.

Patterns on real bars

62 candlestick patterns and 21 formations. The one pattern that never occurred in 40,000 real bars is listed as never occurring — not illustrated.

Costs

The panel that prices the trade before you take it.

Every chart carries a breakeven readout. On OTC it computes the win rate your payout demands. On forex it measures the live spread — median of hundreds of samples, count shown — and reports what share of a typical bar that cost eats. If a number cannot be measured, the panel shows a dash. Nothing on screen is invented, because you could not tell an invented number from a real one.

Breakeven

Payout92%
Win rate needed52.1%
Above a coin+2.1 pts
At 50% you make−4.0% / trade

From the payout above: 1 ÷ (1 + 0.92). Being right half the time is not the break-even point.

Learn

The course that ends every strategy with a number.

Thirty-six lessons across four tiers, each with a practical on the live chart and a quiz with spaced review. The Strategies tier states each method precisely, has you run it in replay, and then reports what it did when it was actually measured — sample sizes, confidence intervals and all.

Foundations10

Assumes nothing. What a chart shows, who the counterparty is, what happens when you press the button.

Intermediate10

The tools, and what each one measures. Including the five families behind all 62 candlestick patterns.

Strategies6

Complete methods, run in replay — each chapter ending with its real measurement, flattering or not.

Advanced10

Judging whether any of it works: expectancy, sample size, drawdown, and testing a rule of your own.

Most courses end a strategy with a promise. Ours end with a number — and for most strategies the number is bad, which is precisely what makes it worth knowing. One method in the course was validated at +0.795 pips per trade over 462 trades, deployed, and lost. The chapter shows the three warnings that were visible in advance. That lesson was learned on a monitored demo account so it does not have to be learned on a funded one.

FAQ

Asked, answered plainly.

What is OTCharts?

A charting terminal and a course in one place: the OTC book your broker quotes, the real market beside it, and a 36-lesson path whose claims are measurements rather than promises.

Are the charts real?

Every bar comes from a live feed we run ourselves, and the claims are built to be checked: cross-rates on the forex book agree with each other, and every example drawing in the app carries the instrument and timestamp it came from. Nothing on a chart is synthesised to fill a gap.

Can I trade on OTCharts?

No — by design. This is a chart and a classroom, not a broker. Analysis reads better without an execution button sitting next to it.

How much does it cost?

Three plans: $19, $29 and $59 a month — Starter, Standard and Pro — with yearly at ten months for twelve on each. What differs is real: broker count, the real-market book, and the course. The pricing page lists all of it on one page. Subscriptions open soon; a free account opens the whole chart today.

Are the charts real-time?

Live. The OTC book quotes around the clock and crypto runs through the weekend; the rest of the real market keeps market hours — and a closed market is labelled closed rather than filled with invented bars.

What indicators and tools are included?

A deep indicator suite — trend, momentum, volume, volatility and price action — computed off the UI thread so the chart never stutters, and growing steadily. Plus 24 drawing tools that survive weekend gaps, replay with the future hidden, and pattern detection on real bars.

Will this make me profitable?

Nobody can promise that honestly, so we do not. What you get is the arithmetic — a 92% payout needs 52.1% just to stand still — the measured costs, and a course whose strategy chapters end with what was actually measured, failures included. Knowing what does not work is the part that saves money.

Why do the pattern examples look unlike textbook drawings?

Textbooks draw idealised shapes no real bar resembles. Our reference is mined from recorded history by the same detectors that mark your chart, with timestamps. The examples look like the real thing because they are the real thing.

What does OTC actually mean?

Over-the-counter: quoted by a counterparty rather than matched on an exchange, often around the clock. It is a different kind of instrument from the real market, which is why the app keeps the two books strictly apart and says which one you are looking at.
The chart is open. So is the maths.

Open it, load an instrument, and check every number on this page yourself — the maths does not care whether you have paid.

Open the chart